Blog

The Top 3 Ways We Save Time Through Technology – And Why Data Matters

Table of Contents

With innovative technology solutions, gone are the days spent mailing paper claims, notating printed agings, and attempting to decipher those handwritten medical records. In recognizing the substantial benefits of these advancements, >a href=”https://hanseisolutions.com/”>Hansei continues to prioritize effective improvements in this modern world.

If you subscribe to the notion that you can’t run a successful business if you don’t know what makes your business successful, you’ve landed at the right place.


Data – Statistics – Analytics

Whatever you call it, it can be daunting if you don’t know where to start, what to analyze, or even why it matters. In fact, technology is nothing without data.

As leaders in the healthcare space, and as an extension of each client’s business, Hansei stays up to date on all payor-specific requirements, allowing informed decisions to be made while supporting your company’s overall growth.


So, let’s get to those top 3 reasons, shall we?

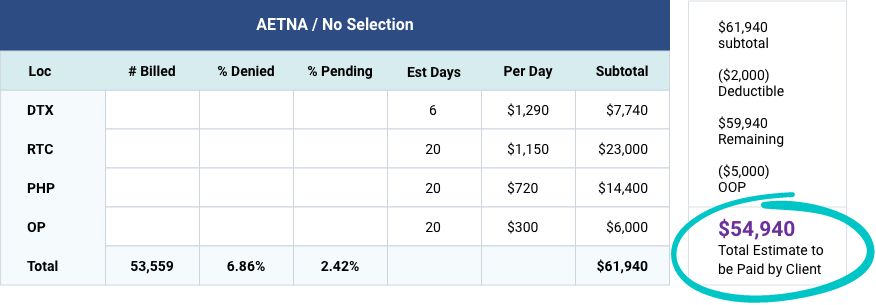
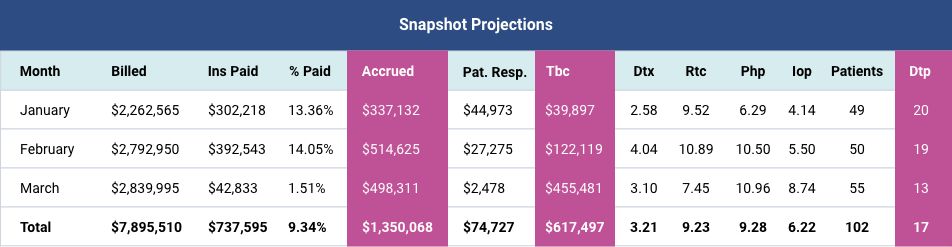
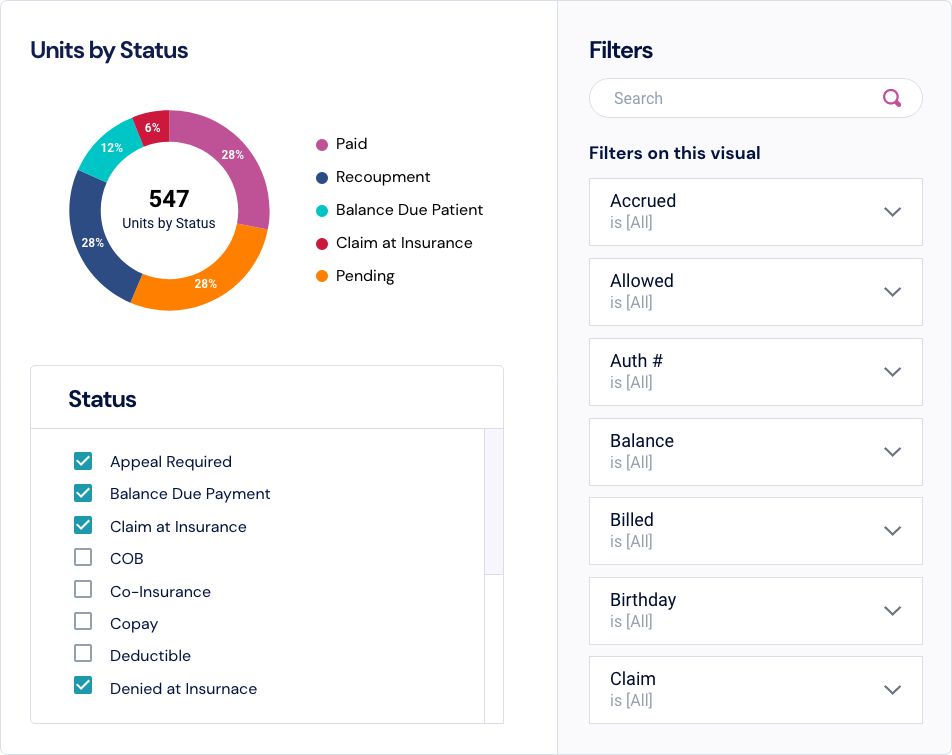
Through Power BI, Hansei’s proprietary online platform, we provide real-time insight into:

1. Benefit Verifications

  • By level of care, Power BI displays the total number of units billed and estimated authorization for a given policy to help understand the corresponding data’s validity.
  • Once you’ve plugged in the member’s financial responsibility (deductible, OOP), Power BI offers a snap-shot (like the example below), including a per-diem and total payment estimate, allowing your facility to make the most informed decision as to whether to admit a potential client.

Power BI snapshot

2. Forecasting Revenue

  • At a glance, Power BI offers snap-shot projections, totaling:
    • Your monthly billing
    • Percentage adjudicated
    • Your remaining ‘to be collected’ estimate (TBC)
    • Your total expected payments for the month (ACCRUED)
  • Just in case that isn’t enough, we’ve included the average number of days billed for each level of care, along with the total number of patients billed, as well as the average time from billing to PAYMENT DAYS TO PAY (DTP).
  • Should you desire to take a deeper dive into your numbers, our platform allows a seamless data extraction into the all-mighty Excel.

Power BI snapshot projections

3. Analyzing Trends

  • We’re all familiar with pie charts, and if done right, they’re effective, especially when you have the ability to click on any single status which will detail all associated patient and claim information.
  • Once you’ve got that detailed information and you find yourself overwhelmed by data, we offer further customization by allowing you to select only what is relevant for you at the time.

Power BI reports

So, what do you do with all of this data exactly?

Glad you asked. That’s where we come in.

‘We offer the next best thing to a crystal ball’ has been a sentiment shared by the team at Hansei, which has been echoed by customers who faithfully utilize our systems to meet their financial goals and grow their business.

Fill out the form below to start your brighter future, or putting it plainly, to schedule your free demonstration.

We’re ready when you are.
– Hansei Solutions

CTA background pattern

Ready to focus on providing healthcare? Let us lighten your load.

Schedule a Demo
888-574-4379

We’re here to address your pain points and create growth opportunities for your organization. We’re passionate about what we do, and it shows in every interaction. Learn what makes us tick and schedule a demo today.

Name*
Service Interested In?*